Tuesday 8 November 2016


In this Paper Partnership graph was introduced. partnershipimg

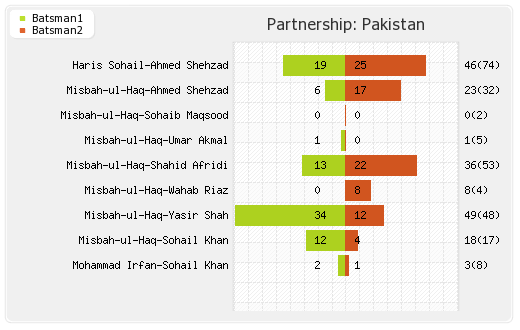
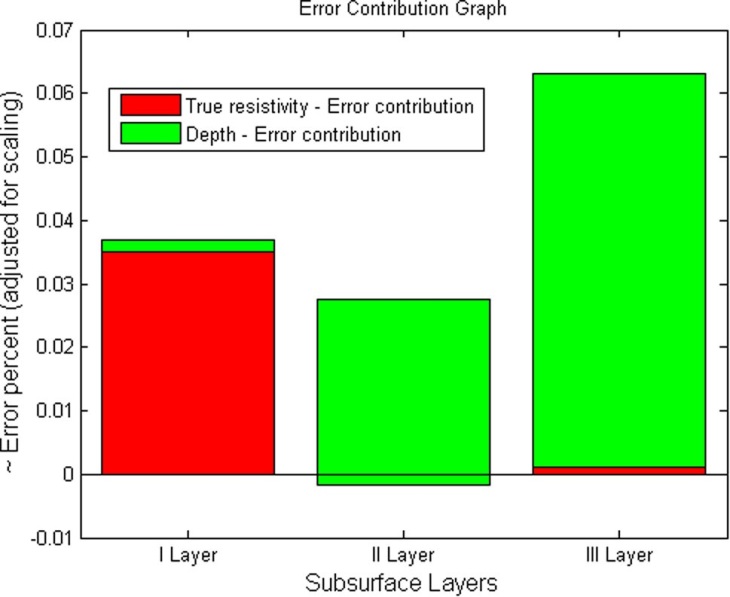
 Like the above image, “partnership of error” graph was introduced. For example the error contribution by two parameters were mapped like the partnership of two batsmen in cricket. In this research work, the contribution of error from the subsurface layer inversion and resistivity values. When I was watching India-Australia Match, the concept arises and applied successfully using MATLAB software…
partnership_graph

Thursday 4 August 2016

Neural Networks Base code with Pre processing and Post processing

load data.txt;
clc
P=data(1:12,1:2)
T=data(1:12,3)
a=data(13:20,1:2)

s=data(13:20,3)
[pn,minp,maxp,tn,mint,maxt]=premnmx(P',T')
[an,mina,maxa,sn,mins,maxs]=premnmx(a',s')
net=newff(minmax(pn),[5 1],{'tansig','tansig'},'traingdm')
net.trainParam.epochs=300;
net.trainParam.lr=0.3;
net.trainParam.mc=0.6;
net=train (net,pn,tn);

y=sim(net,an)
t=postmnmx(y',mins,maxs)
[t s]
plot(t,'r')
hold
% Current plot held
plot(s)
title('Comparison between actual targets and predictions')
d=[t-s].^2;
mse=mean(d)
[m,b,r]=postreg(t',s')